the starting point

real world projects – in an hour or less

Projects

  • Networking at Scale: Automating the “Reach Out to People” Advice

    From Theory to Practice — A Selenium-Powered Experiment

    In my last project (scroll down briefly), I explored who you should network with using Python’s networkx — treating professional relationships like a graph problem. It was a data-driven way to identify high-centrality individuals inside a corporate hierarchy.

    But knowing who to connect with is only half the equation. The harder part? Actually reaching out to them — one message at a time.

    And that’s where this new project comes in.

    Automating Outreach (with a Human Touch)

    I wrote a simple script using Selenium to automate the outreach process of sending a personalized connection requests.

    It does all the basics:
    Click the “Connect”
    Insert a message
    Click “Send”

    But what makes this more than just a glorified spam-bot is the conditional logic baked into the messaging:

    • If we have zero mutuals → keep it humble
    • If we have a few mutuals → name-drop with grace
    • If we have many mutuals → lean into the shared network

    How?

    The beautifulsoup package reads the number of shared mutual connections for the given user and determines which templated message to insert into the personalized messaging.

    Ethics Disclaimer

    No one wants to be that person flooding people with generic messages. And so this isn’t about mass-blasting strangers — it’s about scaling a outreach process to people you would have spent time connecting with anyway. Except it saves you some time from clicking around, copy and pasting and moving between tabs to see mutual connections.

  • Networking: A Theoretical Approach to Climbing the Corporate Ladder

    🧠 Reframing Networking: A Data-Driven Experiment

    Networking advice often feels vague: “Just put yourself out there!” or “Talk to the right people!” But… who exactly are the right people? Instead of relying on gut feelings or LinkedIn stalking, I wanted to approach this question logically.

    This project reframes the typical question — “Who do I network with?” — into a more strategic one: Who should I network with?”

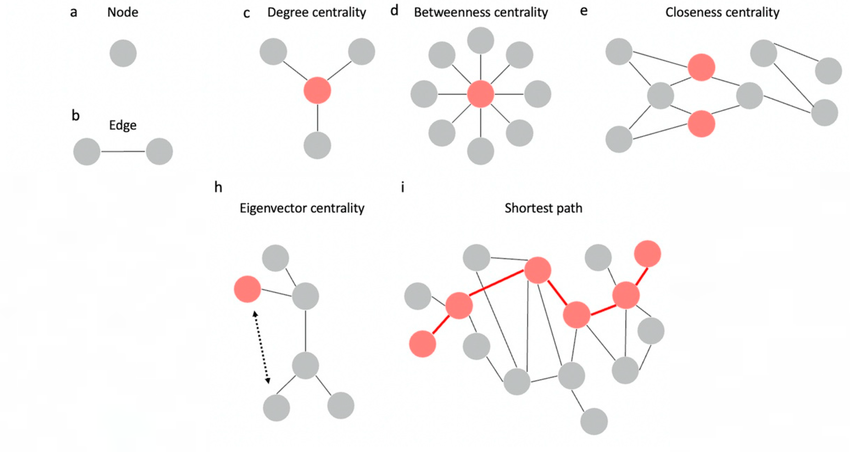
    Using the structure of a corporate hierarchy (where each person has a title and a manager), I applied four centrality measures from network theory — degree, betweenness, closeness, and eigenvector — to give each individual a numerical score representing their position within the social hierarchy of the organization. Or to put it more bluntly: a data-backed sense of how important someone is in the grand org chart of life (corporate life, at least).

    The goal isn’t to gamify your career (okay, maybe just a little), but to offer a logical, fun framework for thinking differently about how we navigate professional relationships.

    If you want to learn how you can improve your eigenvector centrality score and be the envy of your colleagues – Check out the project below.

    This is just the starting point… next, I’ll add a slight twist: simulating what happens when someone new enters your network. For example — using our fictitious company, Backdoor Strategies, Inc. — what would happen if our humble Analyst Donny managed to build a relationship with the company President?

    Would schmoozing with the execs boost his visibility in the company’s network? Stay tune for Part 2.

  • Making Sense of 13F: A Practical Approach to SEC Data

    Content:
    I. Intro: What is 13F? What does this Project Solve & Why?
    II. Data: How to get the data (line-by-line) using Python
    III. Data Visualization using Tableau for end-user to extract insights

    I. Intro

    🚀 Project: 13F Data Extraction + Enriching with Ticker Symbol
    SEC 13F filings provide a quarterly snapshot of institutional investment holdings—key for analyzing trends in asset management, hedge funds, and major public equity moves. In this post, I will showcase line-by-line how to write a Python script to download institutional 13F filings for the 2024 fiscal year from the SEC’s EDGAR system — with a key enhancement: Ticker Symbol.

    🔍 What’s a Ticker Symbol?
    A ticker symbol (like AAPL for Apple or MSFT for Microsoft) is a unique shorthand used on stock exchanges to identify publicly traded companies. It’s how most investors, platforms, and APIs refer to a stock.

    🧩 Why it matters: 13F filings only include issuer names and sometimes vague descriptors. Without ticker symbols, it’s hard to:
    -Connect holdings to pricing data or charts
    -Use the data in most financial APIs or trading platforms
    -Easily analyze or visualize trends across holdings

    ✅ By mapping each holding to its correct ticker symbol, the data becomes:
    -Human-readable and Investor-friendly (simply refer to Apple by AAPL instead of the CUSIP 037833100 (unique 9-number identifier), or its official name ‘Apple, Inc’)
    -Compatible with market data APIs (like Yahoo Finance, Alpha Vantage, etc.)
    -Allow for querying the data in a standardize way

    This enhancement makes the 13F data far more accessible, investor-friendly, and applicable to real-world use cases—a small technical tweak with a big downstream impact.

    If you’re working with public filing data or want to chat about automating ticker mapping—let’s connect!

    II. Data

    III. Data Visualization

  • Client Holdings, Neighbor’s Picks, Your Watchlist—Track it with a Single Click

    🚀 Project: Ticker-to-Custodian Lookup App

    Custodians are financial institutions that manage and report holdings for mutual funds, ETFs, pensions, and other portfolios. In this project, I built a lightweight, browser-based tool that allows users to input a string of ticker symbols—like AAPL, MSFT, AMZN—and instantly see which custodians hold those ticker and the dollar value of each of the ticker.

    While 13F filings disclose this information quarterly, they’re often difficult to navigate and require technical knowledge to interpret. This app bridges that gap: it makes institutional holdings searchable, readable, and accessible—with no technical expertise required. Whether you’re a financial advisor, analyst, or a curious investor, this tool helps you quickly see who owns what, how much, and how it all fits into the bigger picture.

    📈 How it works:

    Simply type in a list of ticker symbols, separated by commas (e.g. AAPL, MSFT, AMZN). The app returns:

    • Custodians that exactly hold those tickers
    • Custodians whose portfolios contain those tickers
    • Plus the asset value tied to each holding

    Why this app matters:
    Whether you’re tracking client portfolios, researching investor sentiment, or just wondering what big funds hold the same stocks your neighbor brags about—the app makes it instant and easy. By linking tickers to custodians and showing the value behind each, it brings real-world market context to something as simple as a stock symbol.

    🛠️ Key features:

    • Clean, comma-separated ticker input
    • Exact and partial match options
    • Custodian name + asset value display
    • Lightweight, intuitive interface

    This tool is part of a broader goal: making institutional data more accessible and usable, whether you’re a researcher, advisor, or just a curious investor.

    🔮 What’s Next?

    One exciting next step is expanding this tool to detect model portfolios—predefined combinations of assets that investment firms use to build client portfolios.

    A model portfolio is essentially a recipe: it’s made up of multiple assets (like AAPL, MSFT, TLT, etc.), each assigned a target percentage. For example:

    • 40% U.S. equities
    • 30% international stocks
    • 20% bonds
    • 10% cash or alternatives

    Further looking into the example, the 40% U.S. equities slice, you might see individual stocks like AAPL and MSFT making up smaller percentages of that portion—say, AAPL is 10% and MSFT is 8% of the total portfolio. Each holding plays a part in completing the full picture.

    These models are widely used in wealth management, robo-advisors, and financial planning platforms. The percentages reflect both the portfolio’s investment strategy and its risk profile.

    By enriching the dataset further, we can begin doing the detective work—reverse-engineering custodians’ holdings to see if they match the makeup of known model portfolios, or at least resemble them closely. This would allow users to:

    • Matching custodians’ holdings and weightings against known model portfolios
    • Spotting portfolios that resemble common investment strategies
    • Inferring the likely portfolio design behind large aggregated holdings

    This would take the app from simply showing holdings, to offering insight into why those holdings might exist—bringing us one step closer to making institutional data as insightful as it is accessible.